
- In addition to this blog see Pivoting with Python in SQL Server
Page Contents
Summary
Pivoting is a technique used to rotate(transpose) rows to columns. It turns the unique values from one column in one table or table expression into multiple columns in another table. SQL Server 2005 introduced the PIVOT operator as a syntax extension for table expression in the FROM clause. PIVOT, the relational operator is a T-Sql proprietary operator and is not part of ANSI SQL Standard.
PIVOT operator structure
Rotating(Pivoting) one table or table expression into another table requires three different elements
- Grouping element
- Aggregating element
- Spreading element
The PIVOT operator accepts only Aggregating and Spreading elements. To avoid possible logical errors we must have a clear understanding of all three parameters, especially the Grouping element.
The following example demonstrates the three elements in action.
Let’s say we want to present the sum of freight(Shipping cost) values per order year for each country that ordered our products.
Set up dbo.Orders_TestPivot table. The script can be found here.
The PIVOT queries below transpose columns from a table expression (ShipCountry, Freight, and OrderYear) into a new table.
The queries are logically identical although they use different types of table expressions. The version on the left uses a Derived query and the one on the right uses a Common table expression(CTE).
More on table expressions can be found here:
My personal preference is the CTE version, so I’ll use that in the following examples. 🙂
| A derived query table expression | Common Table Expression |
SELECT PVT.Shipcountry
      ,PVT.[2018]
      ,PVT.[2019]
      ,PVT.[2020]
FROM (
      SELECT ord.Freight
            ,OrderYear
            ,ord.Shipcountry
      FROM dbo.Orders_testPivot ord
    ) AS tabExpr
PIVOT (
        SUM(Freight)
        FOR OrderYear
        IN ([2018],[2019],[2020])
        ) AS PVT
|
;WITH tabExpr AS
(
    SELECT ord.Shipcountry
          ,ord.Freight
          ,OrderYear
    FROM dbo.Orders_testPivot ord
)
    SELECT  PVT.Shipcountry
           ,PVT.[2018]
           ,PVT.[2019]
           ,PVT.[2020]
    FROM tabExpr
    PIVOT (
           SUM(Freight)
           FOR OrderYear
           IN ([2018],[2019],[2020])
          ) AS PVT;
|
The figure below visually maps the elements of the PIVOT operator and the final result set.
 Figure 1, PIVOT Operation
My personal way of thinking when creating a PIVOT query is;
- Sketch the final result set and visualise all three elements required for the PIVOT operation
- Define a table expression(CTE) that returns:
- Spreading element – what we want to see on columns – OrderYear
- Aggregate element – what we want to see in the intersection of each row and column – Freight
- Grouping element* – what we want to see on rows – ShipCountry
- Add PIVOT operator. The pivot operator returns a table result – in our example, the table result has alias PVT.
- Include aggregate function applied to the aggregate element – SUM(Freight).
- Include the FOR clause and the spreading column – FOR OrderYear.
- Specify the IN clause and the list of distinct, comma-separated values that appear in the spreading element. [2018],[2019],[2020] . In our example, we have a list of irregular identifiers* that needs to be delimited.
If we added a non-existing value to the IN list e.g [2099], the query would execute with no error but with the NULL aggregated values 🙂 - Specify an alias for the PIVOT result table – PVT
- Specify the final SELECT. The columns are selected from the PIVOT result table. The sequence of the selected columns is not relevant.
Note: Irregular identifiers:
We use identifiers to name(identify) SQL Server’s objects i.e stored procedures, tables, views, constraints, column names, attributes ..etc. There is a set of rules for creating identifiers i.e The first character cannot be numeric, so e.g 2018 is an Irregular identifier. To be able to use irregular identifiers we need to “fix” their boundaries/limits or deLimit them. To do that we can use double quotation marks – “2018“ or tSQL specific – square brackets; [2018]. More about SQL Server Identifiers can be found here.
An interesting thing about the PIVOT operator is that it does not include a grouping element. The grouping element is “everything else” that is not a spreading or an aggregating element. In our example, the grouping element is the ShipCountry column selected in the table expression.
If we selected e.g ShipCity along with ShipCountry as the two columns that are not a spreading or an aggregate element, the result would be different.
;WITH tabExpr AS
(
    SELECT ord.Shipcountry --grouping element
          ,ord.Freight
          ,OrderYear
          ,ord.Shipcity  --grouping element
    FROM dbo.Orders_testPivot ord
)
    SELECT  PVT.Shipcountry
           ,PVT.[2018]
           ,PVT.[2019]
           ,PVT.[2020]
    FROM tabExpr
    PIVOT (
            SUM(Freight)
            FOR OrderYear
            IN ([2018],[2019],[2020])
        ) AS PVT;

Figure 2, Group By ShipCountry and ShipCity
This behavior can cause logical errors, especially if we apply the PIVOT operator directly on a table.
In the next experiment, we are not using a table expression to prepare the data set for the PIVOT operator. Instead, PIVOT now operates over the entire table. It implicitly(automatically) groups data by all columns except the orderDate and Freight columns. As we can see in Figure 3, the query produces an unexpected result
--the skewed result
SELECT PVT.Shipcountry
      ,PVT.[2018]
      ,PVT.[2019]
      ,PVT.[2020]
FROM dbo.Orders_testPivot
PIVOT (
       SUM(Freight)
       FOR OrderYear
        IN ([2018],[2019],[2020])
      ) AS PVT;

Figure 3, PIVOT operation directly on a table
To avoid possible logical errors, it is always a good practice to first construct a table expression with the implicitly defined PIVOT elements(grouping, spreading, and aggregating), and then apply the PIVOT operator to the prepared data set.
Horizontal Aggregates
Horizontal aggregates are aggregates across different columns per group.
It would be nice to add a total freight per country across the spreading element – the order years. Here is the base table definition.
There are several ways to achieve this e.g We can simply check for NULL values and add the column values – total_freight = ISNULL(PVT.[2018]) + ISNULL(…
However, it would be cool to implement it by using Table constructor to create a virtual correlated query that summarizes freight data for all order years, per row – uh, that was a mouthful 🙂
Here is what we want to achieve:

We can extend the original pivot CTE from above with the total_freight column.
;WITH tabExpr AS
(
  SELECT ord.Shipcountry,
         ord.Freight,
         ord.OrderYear
  FROM dbo.Orders_testPivot ord
)
SELECT PVT.Shipcountry,
       PVT.[2018],
       PVT.[2019],
       PVT.[2020],
       total_freight = ( SELECT SUM(tab.freight_per_year)
                         FROM (VALUES (PVT.[2018]),
                                      (PVT.[2019]),
                                      (PVT.[2020])
                               ) AS tab(freight_per_year) )
FROM tabExpr
PIVOT(
      SUM(Freight)
      FOR OrderYear IN ([2018], [2019], [2020])
     ) AS PVT;
Multi aggregate pivot
A PIVOT operator can handle only one aggregate element at a time. This means that if we want to use more aggregate elements we need to add more PIVOT operators to our query – a PIVOT operator per aggregate element 😐
In the previous example, our aggregate element was Freight when we calculated the total shipping costs in different countries per year.
This time, we want to calculate the average value of the orders placed in different countries per year and add the results to our query.
Figure 4 shows the desired result

Figure 4, Multi aggregate PIVOT- two aggregate elements
From the result, we can see that the second result set is just “appended” to the first. Basically, we just combined the two PIVOT results using an INNER JOIN table operator and an equality predicate on the ShipCountry column.
The final query uses column aliases to indicate the different data sets.
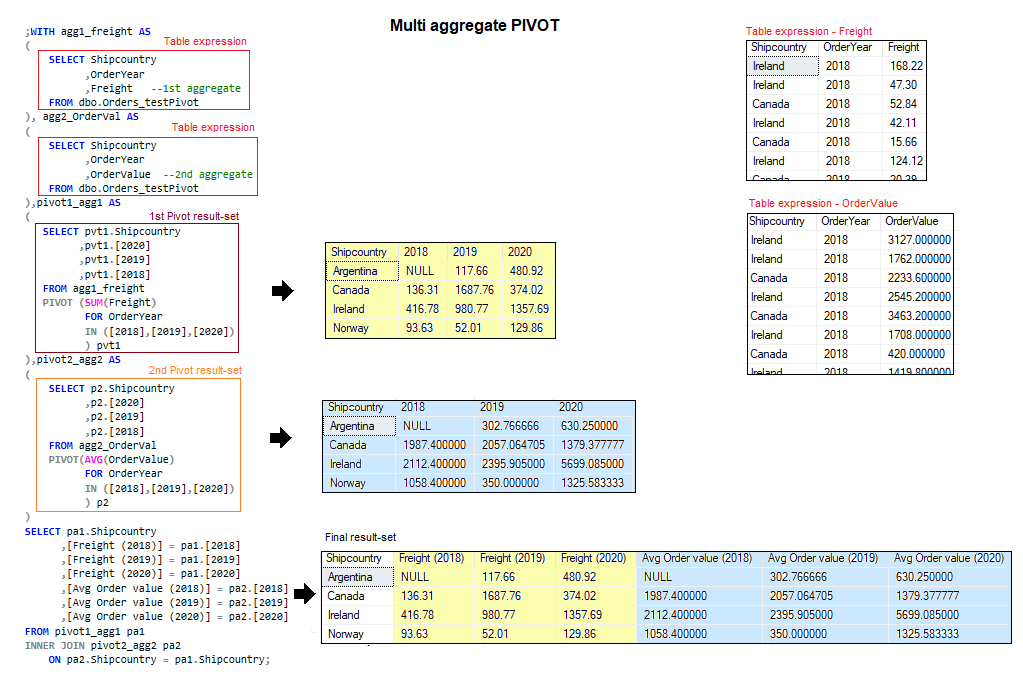 Figure 6, Multi aggregate PIVOT operation
The query in Figure 6 can be found here.
Dynamic PIVOT
A disadvantage of the PIVOT operator is that its IN clause only accepts a static list of spreading values. It does not support e.g a sub-query as input. This means that we need to know in advance all the distinct values in the spreading element. The “hard coding” may not necessarily be a problem in cases when we deal with a spreading element with known spreading values e.g OrderYear.
Going back to the first example, we can easily expand the IN list with the spreading values that are not available yet.
/*A future order
 Note: If truncated, open the code in a new Window */
INSERT INTO dbo.Orders_testPivot (Custid,Orderdate,Shipperid,OrderValue,Freight,Shipname,Shipaddress,Shipcity,Shipregion,Shipcountry)
    VALUES (51,'20210201',2,$220,$350,N'Future shipment :)',N'10178 106 St',N'Edmonton',N'Alberta',N'Canada');
GO

;WITH tabExpr AS
(
    SELECT ord.Shipcountry
          ,ord.Freight
          ,OrderYear
    FROM dbo.Orders_testPivot ord
)
    SELECT  PVT.Shipcountry
           ,PVT.[2018]
           ,PVT.[2019]
           ,PVT.[2020]
           ,PVT.[2021]
           ,PVT.[2022]
    FROM tabExpr
    PIVOT (
            SUM(Freight)
            FOR OrderYear
            IN ([2018],[2019],[2020],[2021],[2022])
        ) AS PVT;
Things get more complex when we cannot predict all possible spreading values. In these situations, we can first design a query that will give us a distinct list of spreading values and then use that list to dynamically construct the final PIVOT query, the Dynamic Pivot.
A typical scenario in which we use Dynamic pivoting is when transposing attributes of an EAV*(Entity-Attribute-Value) data model.
EAV* is one of the open-schema data models (XML, JSON …) that, in some cases, can provide more flexibility than the relational model. Here is an interesting post about EAV.
Let’s say we have a list of Products. Each product is different and can have a specific set of attributes. e.g a bicycle can have a specific type of tires and a hard drive can have a specific capacity..etc. Business frequently adds new products and product attributes. In the next example, I used a simplified EAV model to store the products. The table script can be found here.
Our next task is to return a row for each distinct product, a column for each distinct product attribute, and in the intersection of each product and attribute, we want to see the value of the attribute.
Figure 7 shows the desired output for all products and for a specific product
 Figure 7, Dynamic pivot result
In this scenario, we cannot know all the possible Attributes(the spreading element values). Moreover, the list of attributes is constantly changing, so hard-coding the IN list is no longer an option.
The following is a dynamic pivot query that can give us the result in Figure 7.
DECLARE @sprdElements AS NVARCHAR(MAX) --comma separated, delimited, distinct list of product attributes
        ,@tSql AS NVARCHAR(MAX)        --query text
        ,@ObjectName VARCHAR(255);     --specific product name

SET @ObjectName = NULL -- 'BMC Road Bike' --specific product

--comma separated list of attributes for a product
;WITH dsitSpreadElList AS
(
    SELECT DISTINCT Attribute
    FROM Products
    WHERE ObjectName = @ObjectName
        OR @ObjectName IS NULL
)
SELECT @sprdElements = COALESCE(@sprdElements+', ','')+'['+ CAST( Attribute AS NVARCHAR(255))+']'
--SELECT @sprdElements = STRING_AGG('['+Attribute+']',',') --Available in SQL2017+
FROM dsitSpreadElList;

--print @sprdElements

SET @tSql =N';WITH TabExp AS
             (
                SELECT ObjectName -- grouping element
                      ,Attribute  -- spreading element
                      ,[Value]    -- aggregating element
                FROM dbo.Products
                WHERE ObjectName = @ObjName
                  OR @ObjName IS NULL
	     )
             SELECT ObjectName,'+@sprdElements +N'
             FROM TabExp
             PIVOT (
                    MAX([Value])
                    FOR Attribute IN (' + @sprdElements +N')
                    ) AS pvt';

 EXEC sys.sp_executesql
     @stmt = @tSql
    ,@params = N'@ObjName VARCHAR(255)'
    ,@ObjName = @ObjectName;
NOTE: To extract a known Attribute value, in this case, we can use MAX() or MIN() aggregate functions. Both functions will operate on a single value and will return a single value. Keep in mind that MIN and MAX as well as all other aggregate functions except COUNT(*), ignore NULL values.
The new attributes will be automatically handled by the dynamic query.
INSERT INTO dbo.Products
   VALUES ('BMC Road Bike',
           'Gearing',
           CAST(CAST('Triple chain-ring 50/39/30' AS VARCHAR(255)
                    ) AS SQL_VARIANT
               )
   );
A couple of versions of the dynamic query can be downloaded here.
Conclusion
Pivoting is a technique used to transpose rows to columns. PIVOT is a tSql proprietary operator and is not part of the ANSI Standard. PIVOT operator accepts two parameters; Spreading element or what we want to see on columns and aggregating element or what we want to see in the intersection of each distinct row and column. The grouping element is the third parameter involved in pivot operation. It is what we want to see on rows. The grouping element is not a formal part of the PIVOT operator and represents all columns that are not defined as spreading or aggregating elements. The implicit nature of the grouping element can lead to logical errors. This is why is recommended to construct a table expression for the PIVOT operator that provides exactly three elements needed for the operation.
A PIVOT operator is limited to only one aggregate function. To perform multi aggregate pivot we need to introduce a PIVOT operator per aggregation.
The IN clause of the PIVOT operator accepts only a hard-coded, comma-separated list of spreading element values. In the situations when the values are not known, we use dynamic sql to construct the query.
Thanks for reading.
Dean Mincic
 Figure 8, Sql Server ML Services

